How accurate is ASIO X? Measuring an 81 m tunnel
ASIO X validation study

ARTICLE
How accurate is ASIO X? Measuring an 81 m tunnel from the air
Why measurement accuracy matters underground
In a recent validation study, ASIO X point clouds measured an 81.0 m tunnel at 80.25 m on average — within 1% of the true length, across 10 flights flown by four different drones.
Inspection teams don’t only need to see a defect. They need to know where it is and how big it is: how far a crack sits from the manhole, how long a damaged section runs, what length of liner to order. Underground there is no GPS to fall back on, so every distance has to come from the drone itself.
ASIO X positions itself with visual-inertial odometry (VIO) cameras, an IMU and radar, while its orientable LiDAR builds a 3D point cloud of the space. That point cloud is what you measure in. This post shows how accurate those measurements are, and how to fly to get the best results on your own sites.
The test: one tunnel, four drones, ten flights
We flew a building service tunnel in Lausanne, Switzerland, and compared every measurement with a tape-measured reference.
- Reference distance: 0m, wall to wall, measured with tape.
- Drones: four production ASIO X units.
- Flights: 10, flown on four days, mostly as back-to-back pairs.
- Firmware: the flights ran on release 0.7.0, the current release at the time of the study (August–October 2025). Later releases, up to 0.11.0 (current as of October 2026), include no changes that affect these results.
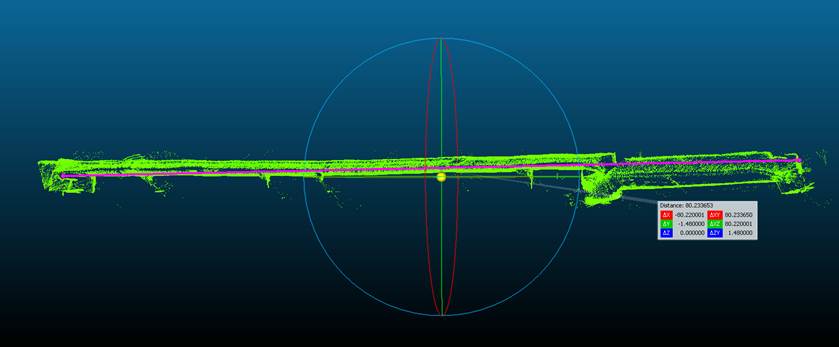
- Method: after each flight, the point cloud was exported and the distance between the two end walls was measured point to point in 3D, using CloudCompare.
Results: under 1% off on average, 0.19 m between flights
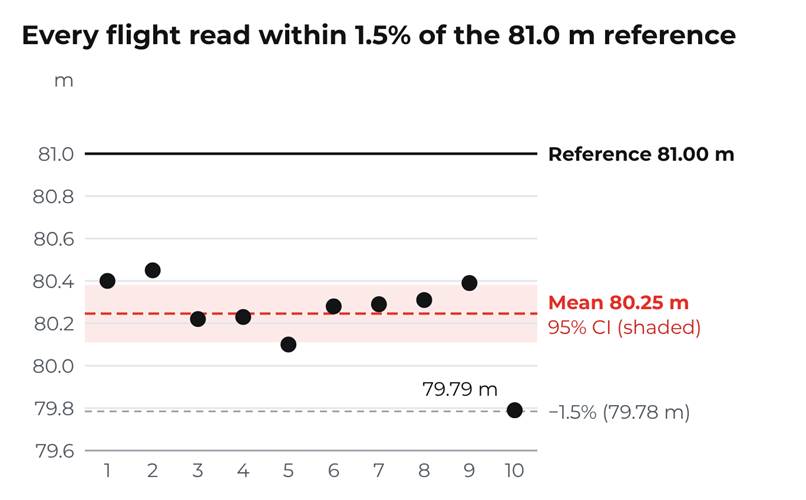
Every flight measured the 81.0 m distance at between 79.79 m and 80.45 m. On average the point clouds read 80.25 m — 0.75 m, or 0.93%, short of the reference.
Metric | Result |
Average error | −0.75 m (−0.93%) |
Spread between flights (standard deviation) | 0.19 m (0.24%) |
Largest single-flight error | −1.21 m (−1.49%) |
95% confidence interval of the mean | 80.11 – 80.38 m |
Accuracy and precision answer different questions
- Precision asks: do repeat flights agree? Here, readings from four drones over four days have a standard deviation of just 0.19 m. That is excellent repeatability.
- Accuracy asks: how close is the average to the truth? Here, 0.93% short, with every flight erring in the same direction.
Why the environment matters
This tunnel is rich in geometric features, which give the drone plenty to track. In a plain, featureless pipe, point cloud accuracy can drop sharply.
So treat these numbers as what ASIO X achieves in good conditions, not a guarantee for every asset. Results vary with the shape and features of each site. When an absolute distance matters, check the scale against a known length on site or, ideally, georeference the point cloud.
How to fly for accurate measurements
A measurement is only as good as the flight behind it: the drone’s position estimate and the LiDAR point cloud are built while you fly. These are the habits behind the results above.
Before you fly
- Run the latest firmware. As of October 2026, that is release 0.11.0.
- Check the airflow. ASIO X tolerates up to 3 m/s of wind but is near its control limit there. Strong ventilation drafts make the flight less smooth and the data less consistent.
- Clean the camera lenses and the LiDAR window. The positioning cameras need a clear view of the walls; dust or droplets on the optics degrade both tracking and the point cloud.
- Decide your endpoints before take-off. Know exactly which two surfaces you will measure between (for example, manhole wall to end wall) and plan to capture both in one flight.
Take-off
- Arm, then wait 10 seconds before take-off. The LiDAR starts recording about 7 seconds after arming, so a 10-second wait makes sure the whole flight is captured. Start from a stable, well-lit spot with textured surfaces in view.
- Set the lights high. The positioning cameras track surface texture, and the 40,000-lumen lighting is what gives them that texture in total darkness. Full lights cost about 2 minutes of flight time — a fair trade on a measurement flight.
During the run
- Fly one smooth, continuous pass at a steady, moderate speed. Abrupt stops, sharp accelerations and fast turns are the moments where position estimates drift.
- Use the pilot assists. Tube Lock keeps the drone centred in a pipe, and position control holds it steady. Staying centred also keeps the drone out of the turbulence near the walls.
- In narrow pipes, keep moving forward. Below about 1.5 m diameter, hovering stirs up turbulence; steady forward flight is smoother.
- Keep the LiDAR angle fixed. An angle of 0° works best for tunnel and sewer mapping. Other angles are fine, as long as the LiDAR doesn’t move excessively during the flight.
At each endpoint
- Stop short of the wall and hold a brief, stable hover. You want each end wall captured as a dense, flat surface, not a few scattered points.
- Capture both endpoints in the same flight. Distances can only be measured between points in the same point cloud.
Fly it twice
- Repeat from the same start position. Start each flight within ±0.2 m of the same spot, so repeat runs can be compared.
Taking the measurement
A good flight still needs a careful pick. In our study, each point cloud was exported and measured in CloudCompare, which measures point to point in full 3D. ASIO Explore can also measure distances on site; for critical lengths, a 3D point cloud tool gives the most reliable result.
- Pick points on solid surfaces. Zoom in until you can see each end wall as a dense surface, and click on the wall itself — not on a stray point, an edge or noise in front of it.
- Measure along the pipe axis. Pick both points at roughly the same height and position across the pipe. Check the X, Y and Z components of the result: along a straight pipe, almost all of the distance should sit on one axis.
- Compare your repeat flights. Take the same measurement in each flight’s point cloud. Two readings that agree are good evidence the data is sound.
- Check the scale. Measure a known length in the same point cloud, or georeference it, before reporting absolute distances.
What this means for inspection teams
Within 1.5% over 81 m on every flight, in a feature-rich tunnel, means ASIO X point clouds can support distance measurements without sending anyone in — as long as you fly carefully and check the scale on each new asset.
- Measure from the point cloud. Section lengths and the positions of defects come straight from the data.
- Count on repeatability. Readings varied by a standard deviation of just 0.19 m across four drones and four days.
- Check, then trust. A scale check or georeferencing turns a good point cloud into a reliable measurement on any asset.
For more information, visit www.flybotix.com
Media contact
media@flybotix.com
ELEVATE YOUR INSPECTION PROCESS
Talk to Our Team
Connect with our team for a firsthand look at the drone’s stability, assist functions, and maneuverability, ensuring all your questions are answered to experience our advanced technology.
View More Case Studies
enter text blah blah for this

Case Study 1
A short description of the service and how the visitor will benefit from it.
Case Study 2
A short description of the service and how the visitor will benefit from it.
Case Study 3
A short description of the service and how the visitor will benefit from it.
Case Study 4
A short description of the service and how the visitor will benefit from it.